
Script Editing Tools
The Altium NEXUS Scripting system is composed of two main parts – the editor and the debugger. The editor offers a range of scripting code help and inspection features, and the debugger provides access to script components and debug features.
Scripting Tools
The scripting system provides a range of tools to help you write and debug scripts. Along with automated code completion and analysis capabilities, the scripting system allows you to interactively step through scripts line by line, inspect variables and objects, and set breakpoints on one or many lines in the script.
The Scripting Editor Tools are a key asset when debugging scripts.
Code Completion
The editor supports a code completion feature, which is an automated pop-up window that displays context-sensitive code options.
When you type in a period after an object interface name, a list of available properties and methods for that object are shown in a code completion pop-up menu window – continue typing to further narrow the list. Selecting an option from the list will populate the code with that procedure/function or property.
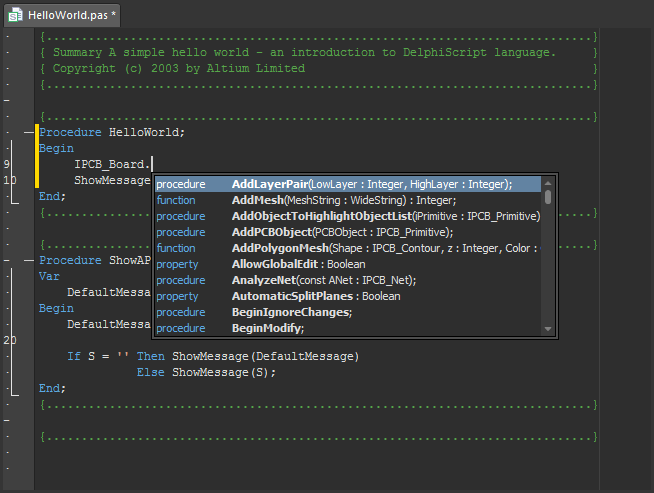
You can use the Ctrl+Space shortcut keys to bring up the Code Completion list window at any time.
The Code Completion feature is extremely useful when selecting the correct Object Interface, method and property to apply in a script.
► See Script API Objects for information on choosing and applying Object Models in scripts.
Statement Templates
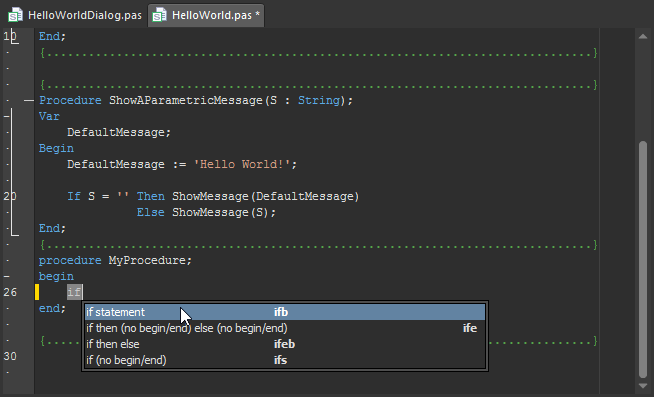
The script template feature will automatically generate a code structure for the statement selected from the pop-up list window.
The pop-up list can be activated at any time by the Ctrl+J shortcut keys or the Show Code Templates button ( on the Text Utilities toolbar). If activated after typing the first few letters of a code statement, for example, '
proc', the matching statement code will automatically populate the document code with the Procedure structure.
Alternatively, if there are a number of statements available for the pre-typed code letters (for example 'if') the template list window will offer a filtered list of statements.
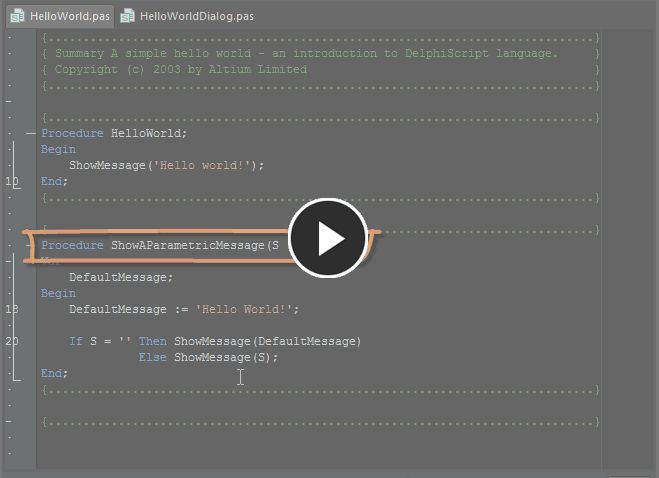
Method Parameters
The Script Method Parameters feature displays a pop-up message that shows which parameters are used for a particular method (function/procedure etc) of an object interface.
When the initial round bracket is typed following a method, as shown in the image below, the Parameters message will automatically appear. The Shift+Ctrl+Space keys can be used to manually display the Parameters pop-up message, where applicable.
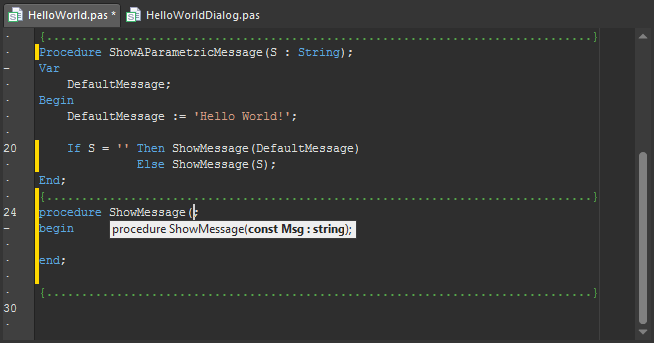
To see the parameter definition for a completed method statement, place the cursor within its parameters brackets and use Shift+Ctrl+Space to the call the pop-up.
Definition Navigation
The source of a script variable or method definition can be immediately located using the editor's Navigation feature.
To find a definition source for a variable, press the Ctrl key while clicking on the variable where it's used in the script. The cursor will relocate to the definition. Use the same method (Ctrl+Click) to locate a procedure's source definition. If the procedure is defined in another script within the project, that script will open with the cursor at the procedure.
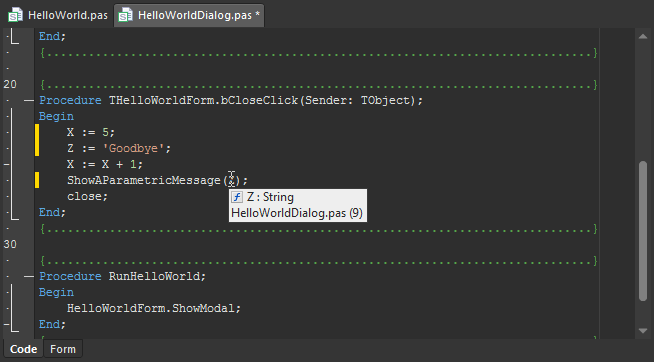
Insight ToolTip
The Insight ToolTip feature shows the variable type when the mouse cursor is hovering over the variable. Similarly, hovering the mouse over a procedure shows its definition and location (script and line number).
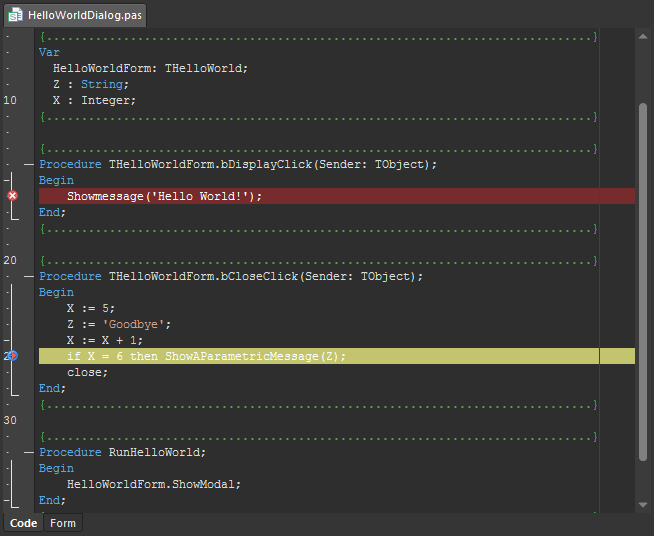
Breakpoints
Breakpoints are a primary debugging tool that allow you to pause the execution of a script at predefined points.
The simplest way to specify a Breakpoint is by clicking in the editor's gutter alongside a line of code, which becomes highlighted in red. The line highlighting will change to a pea-green color when a running script has encountered that Breakpoint. The script can run to the next Breakpoint with the Run command or button ( ).
).
Breakpoints can be accessed via the Breakpoints panel to easily locate and manage all set breakpoints, without going through a script to locate them.
Expression Evaluation
When a script is stopped in response to a breakpoint or error, the value of any expression (a script statement) can be determined by a ToolTip feature or via the interactive Evaluate dialog.
The Evaluation tools are primarily debugging tools, used in conjunction with debugging help panels such as the Watch List and Call Stack panels.
Evaluation ToolTip
The Expression Evaluation ToolTip feature displays the current data value for the variable that the cursor is hovering over.
Evaluate Feature
To use the editor's Evaluate dialog, click on an expression variable in the script and select the Evaluate button ( on the Script Debug toolbar) or press the Ctrl+F7 shortcut keys. The dialog will be automatically populated with the expression and its current result.
Alternatively, you can copy an expression from the script to the dialog's Expression field and click Evaluate to see the result. An expression name can also be typed directly into the Expression field to evaluate the result.

A script in breakpoint mode with the Evaluate dialog activated.
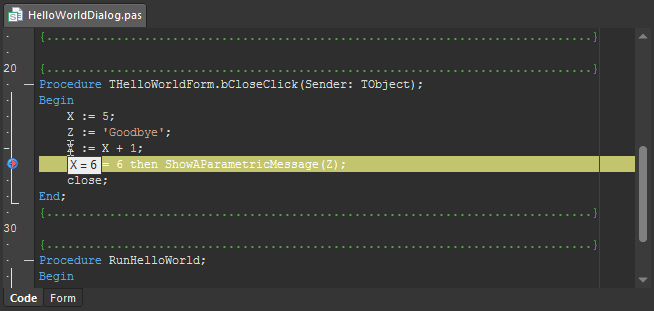
Bookmarks
Bookmarks are used in scripts to note statements and navigate to them quickly. Up to 10 bookmarks can be defined in a script.
A Bookmark is indicated by a green box in the editor gutter with the Bookmark number enclosed. To add a bookmark, select a line of code, right-click, select Toggle Bookmarks from the context menu, and then a location number from the sub menu (Toggle Bookmarks » Set Location Mark n, where 'n' is the bookmark number from 0 to 9).
To go to (jump to) a Bookmark, right-click then select Goto Bookmarks and the desired bookmark location from the sub menu (Goto Bookmarks » Jump Location Mark n). To remove a Bookmark, toggle the bookmark off by repeating the add bookmark process for that code line.

Use bookmarks to jump to a statement in the script quickly.
Scripting Shortcut Keys
Shortcut keys are assigned to common scripting operations, as detailed below.
► See the Shortcut Keys documentation page for additional shortcuts information.
Editing Scripts
| F9 | Run the current script. If a run script is not defined, nominate a startup script procedure to execute in the Select Item to Run dialog. |
| Ctrl+F9 | Run the script to the current cursor position, then pause. |
| Ctrl+F3 | Halt (stop) a currently running script procedure. |
| F5 | Toggle a Breakpoint for the current script line (or click in the gutter area). |
| Ctrl+Space | Pop up the Code Completion list window. |
| Ctrl+J | Pop up the Statement Templates list window. |
| Shift+Ctrl+Space | Activate the Method Parameters pop up window. |
| Ctrl+F | Open the Find Text dialog. |
| F3 | Find next text instance. |
| Ctrl+H | Open the Replace Text dialog. |
Script Bookmarks
| Ctrl+[0 – 9] | Jump (go to) a Bookmark location mark — for example, Ctrl+3 jumps the cursor to Bookmark number 3. |
| Ctrl+Shift+[0 – 9] | Toggle a Bookmark on the current line, or move an assigned Bookmark to the current line. |
Debugging Scripts
| CTRL+Click on variable/method | Jump the cursor to the respective variable/method declaration point. |
| F7 | Step into and execute the next line of code. Use to execute the current script one line at a time. |
| F8 | Step over (execute without stopping) a called procedure. If the line statement is not a called procedure, step into and execute the line as normal. |
| Ctrl+F7 | Open the script Evaluate dialog to see the current value (result) of the expression located at the cursor. |
Opening Panels
| Ctrl+Alt+B | Open the Breakpoints panel. |
| Ctrl+Alt+S | Open the Call Stack panel |
| Ctrl+Alt+E | Open the Code Explorer panel |
| Ctrl+Alt+I | Open the Object Inspector panel |
| Ctrl+Alt+P | Open the Tool Palette panel |
| Ctrl+Alt+W | Open the Watch List panel |