
Ensuring Design Integrity with Design Rule Checking (DRC) in Altium Designer
Design Rule Checking (DRC) is a powerful automated feature that checks both the logical and physical integrity of a design. Checks are made against any, or all enabled Design Rules, and can be made online - in real-time as you design - or as a batch process, with results listed in the software's Messages panel and a (optional) generated report.
This feature should be used on every routed board to confirm that minimum clearance rules have been maintained and that there are no other design violations. It is particularly recommended that a batch mode design rule check always be performed prior to generating final artwork.
Configuring the DRC
Configuration for design rule checking is performed in the Design Rule Checker dialog, accessed through the Tools » Design Rule Check command.
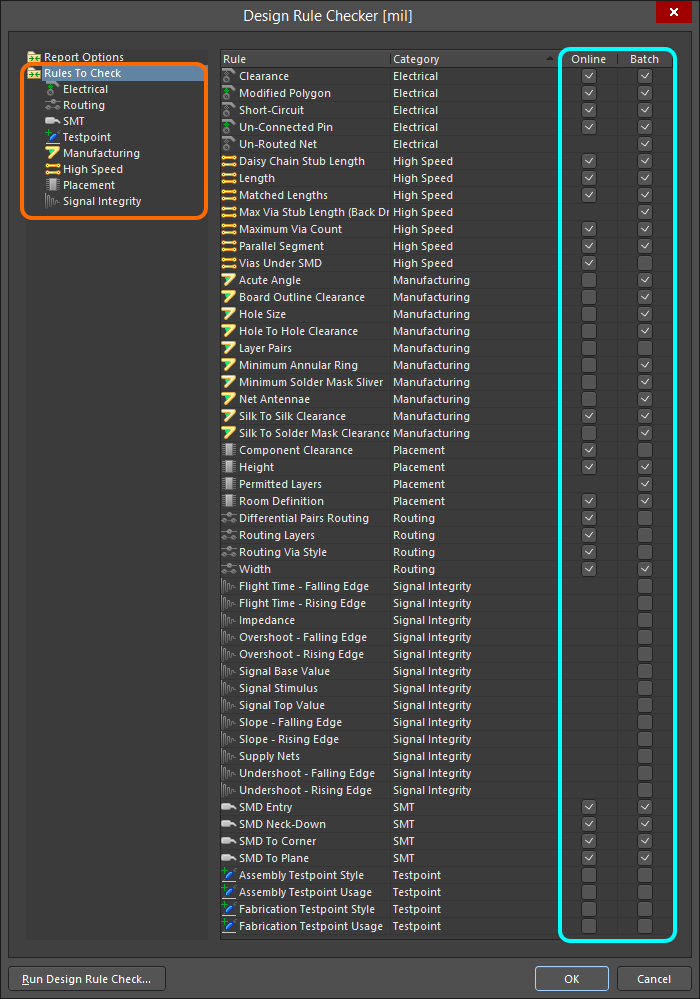 The Design Rule Checker dialog. Defaults are shown, with certain Online DRC checks disabled to improve PCB Editor
performance. Use the associated options to include a design rule type for checking as part of Online DRC and/or Batch DRC.
In the folder-tree pane on the left side of the dialog, each of the design rule categories, whose rule types can be checked, are listed under the Rules To Check folder. Click on this top-level folder to list all checkable rule types on the right side of the dialog. Alternatively, click on a specific category to list only those design rule types associated to that category. Use the dialog to enable/disable Online (where available) and/or Batch Mode checking for each rule type you wish to check.
Using Online DRC
Online Design Rule Checking runs in the background, in real-time, flagging and/or automatically preventing design rule violations. This is especially helpful when interactively routing your board, to immediately highlight clearance, width and parallel segment violations. For a rule to be subject to the Online DRC, the following three requirements must be met:
- The rule must be enabled. This can be done in either the PCB Rules and Constraints Editor dialog, by ensuring the Enabled option for the rule is checked, or in the PCB Rules and Violations panel, by ensuring the On option for the rule is checked.
 Ensure that design rules you wish to have monitored by the Online DRC are actually enabled for use in the design.
- The rule type must be enabled for online checking in the Design Rule Checker dialog.
 Ensure that the rule type is enabled for Online DRC.
- The Online DRC feature must be turned on. Do this by enabling the Online DRC option, on the PCB Editor - General page of the Preferences dialog.
 Ensure that the Online DRC feature is enabled.
If any objects are found to be in violation of an applicable design rule that is enabled for online checking, they will be highlighted in the main workspace, in accordance with defined violation display options.
Using Batch DRC
Whereas Online DRC only detects new violations - violations that are created after the feature is enabled - Batch DRC allows a check to be manually run at any time during the board design process. So while good designers know the value of Online DRC, they also know that board design should begin and end with a Batch DRC.
Enable rule types for batch checking in the Design Rule Checker dialog as required (refer back to Configuring the DRC). Various additional options are available when running a Batch DRC, including the ability to generate a report file. These options are accessed by clicking on the Report Options folder, in the folder-tree pane of the dialog. Two key options (highlighted in the following image) are:
- Create Report File - enable this option to generate a DRC report.
- Create Violations - enable this option to have violations highlighted in the workspace, in accordance with defined violation display options. This option is also required to have violations appear listed in the Violations region of the PCB Rules And Violations panel.
 Accessing options applicable to running a Batch DRC, and generating a DRC report.
A batch-mode DRC is initiated by clicking the Run Design Rule Check button, at the bottom-left of the dialog. After the check has completed, all violations are listed as messages in the Messages panel. If you opted to do so, a DRC report will be created, and automatically opened (if configured to do so) as the active document in the main design window. The report lists each rule that was tested, as specified in the Design Rule Checker dialog. Rules that are not present in the design are not tested.
DRC Reports
Enabling the Create Report File option in the Design Rule Checker dialog will generate a DRC report upon execution of a Batch DRC. Options available on the PCB Editor - Reports page of the Preferences dialog allow specification of report format, and whether the report is automatically displayed after generation.
 Generate a DRC report as part of the Batch DRC process.
 Generate a DRC report as part of the Batch DRC process.
Supported formats are:
- TXT - generates the file Design Rule Check - <PCBDocumentName>.drc.
- HTML - generates the file Design Rule Check - <PCBDocumentName>.html.
- XML - generates the file <PCBDocumentName>.xml .
The report lists each rule that was tested during the batch checking process, as specified in the Design Rule Checker dialog. Each violation that was located is listed with full details of any reference information, such as the layer, net name, component designator and pad number, as well as the location of the object.
Violation Display Options
Checking the design against specified design rules is one thing, but what happens when one or more of those rule are violated? Whether running Online DRC during design, or manually running a Batch DRC, there needs to be some visual indication of where such rule violations are occurring. The PCB Editor includes powerful violation display options to indicate where violations exist in a clear, visual way.
Custom Violation Graphics
Most design rules that can be included in either Online and/or Batch design rule checking have associated custom violation graphics - appearing within the workspace when a particular rule is violated. These graphics provide a visually cleaner DRC landscape. When a particular design rule is violated, the associated custom violation graphics (where applicable) are only drawn on the layer(s) involved with that violation.
In some cases, the graphic shows not only where the violation is occurring, but also why - displaying the constraint value defined for the rule and indicating how the offending primitive(s) are either below or above this value.
 Example illustrating the custom graphics used for width and minimum annular ring rule violations.
Other graphics, including those used to represent violations of Net Antennae, Short-Circuit, Un-Routed Net, Room Definition, Layer Pairs and Vias Under SMD rules, will simply be a graphic, as there is no definable constraint value to be displayed.
 Additional examples of custom violation graphics. From left to right: Net Antennae violation; Short-Circuit violation; Un-Routed Net violation.
Violation Overlay
In addition to the custom violation graphics, a violations 'overlay' is available for setup and use. The overlay draws over design primitives. You have a choice of what pattern to display on the primitives, from a selection of styles.
 Use a violation overlay as an alternative to the custom violation graphics when displaying DRC violations.
Using a combination of the two violation display types can prove useful in terms of providing a 'coarse' and 'fine' indication of violations. When zoomed out, the violation overlay can flag where a violation exists, then zoom in to view the detail delivered by the associated custom violation graphic.
Configuring Violation Display Preferences
Control over how DRC violations are displayed - using the custom violation graphics and/or a defined violation overlay - is specified on the PCB Editor - DRC Violations Display page of the Preferences dialog.
 Configure how DRC violations are displayed in the workspace - using custom graphics and/or a defined violation overlay - as part of your software preferences.
Options available allow you to:
- Choose the style of violation overlay used.
- Determine violation overlay display behavior when zooming out.
- Choose the display style used, on a per-rule basis. Enabling the Violation Details option for a rule type will use the associated custom violation graphics to display the DRC violations of that rule. Enabling the Violation Overlay option will display the violations using the specified overlay style.
Defining Violation Coloring
To give further flexibility when displaying rule violations in the workspace, the two violation display types - violation details (custom violation graphics) and violation overlay - have separate associated system colors. This allows you to differentiate between the two using different, distinct colors. Color assignment is performed in the System Colors section, on the Layers & Colors tab of the View Configuration panel:
- Violation Details – uses the Violation Markers system color (for waived violations using this display style, uses the Waived Violation Markers system color).
- Violation Overlay – uses the DRC Error Markers system color (for waived violations using this display style, uses the Waived DRC Error Markers system color).
 Specify different coloring for the two violation display types, and enable/disable their display as required.
 , otherwise the associated violation details or violation overlay will not be displayed.
Interrogating & Resolving Design Violations
With care and attention, and staged design rule checking along the way, running that final Batch DRC on the finished, fully routed board, may yield only a few design violations, if any. However, there may be a sizeable quantity of violations flagged, and now the task becomes one of resolving those violations.
DRC reports generated by running a Batch DRC can appear quite daunting to the new PCB designer. The secret to keeping the process manageable is to develop a strategy. One strategy is to limit the number of violations that are reported. When setting up the report options in the Design Rule Checker dialog, set the Stop When Found feature to a small number. Another strategy is to run the DRC in a number of stages. If the design contains a large number of violations, begin by enabling the rules one at a time. With experience, you will develop a preferred approach to testing the various design rules.
To effectively resolve a design violation, you must first be able to locate it. The PCB Editor provides various methods for interrogating design violations, as described over the following sections.
From the PCB Rules And Violations Panel
When running an Online or Batch DRC, any rule violations will be listed in the Violations region of the PCB Rules And Violations panel. Browse violations associated with a specific rule class, or individual rule within a class. Alternatively, browse all violations by selecting the [All Rules] class.
Clicking on a violation entry will apply filtering using the offending object(s) as the scope of the filter. The resulting view in the main design window will depend on the highlighting options enabled (Mask/Dim/Normal, Select, Zoom) at the top of the panel.
 Interrogate rule violations using the PCB Rules And Violations panel.
Double-clicking on a violation entry (or right-clicking and choosing Properties) will open the Violation Details dialog, which provides information about the rule being violated and the primitive(s) responsible. From this dialog the offending object can be highlighted (causing it to flash in the workspace) and jumped to, effectively providing 'zoom and center'.
 the primitives involved in a design rule violation.") Using the Violation Details dialog to highlight (and jump to) the primitives involved in a design rule violation.
Using the Violation Details dialog to highlight (and jump to) the primitives involved in a design rule violation.
From the Messages Panel
After running a Batch DRC, double-clicking on a violation message in the Messages panel will cross-probe to the object(s) causing that violation in the workspace.
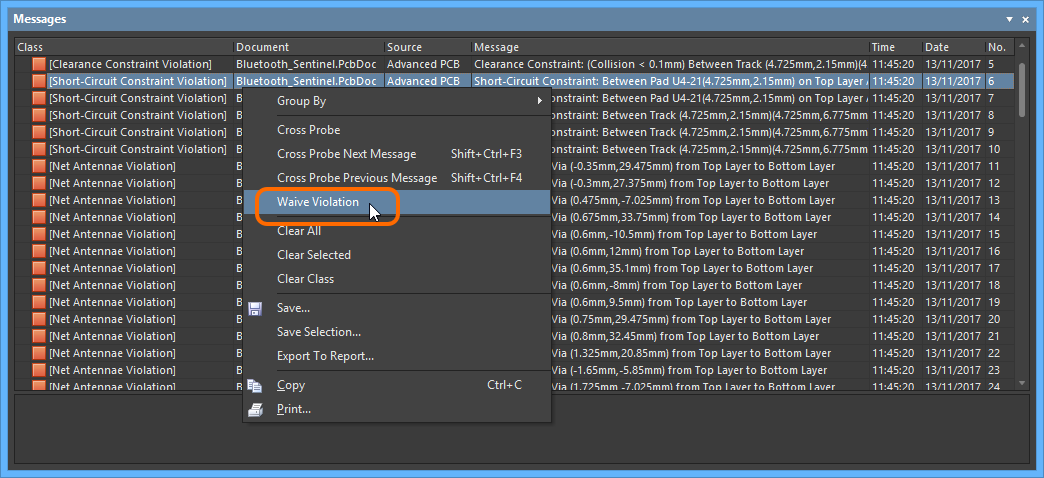
 Cross-probe to a violation from the Messages panel.
From a Generated DRC Report
If the option to Create Report File is enabled in the Design Rule Checker dialog, violations detected upon running a Batch DRC will be listed in a generated Design Rule Verification Report. Click on the hyperlinked entry for an offending object to cross-probe directly to that object in the workspace.
 Cross-probe to an offending object from the generated DRC report.
Directly in the Workspace
Violations associated with a particular design object can be interrogated directly within the PCB workspace. Position the cursor over an offending object, right-click and choose a command from the Violations sub-menu. Either choose to investigate an individual violation that the object is involved in, or choose to view all violations in which it is involved, using the Show All Violations command. In each case, the Violation Details dialog will appear, providing detailed violation information and controls for highlighting and jumping to the offending object(s).
 Interrogate violations involving a specific object directly in the workspace.
Violations can also be browsed directly in the workspace using the Board Insight pop-up. Position the cursor over an object in violation and toggle display of the pop-up using the Shift+V keyboard shortcut. Click on a violation entry to access a menu of commands, including Properties, which gives access to the Violation Details dialog. Expand an entry to browse the primitive(s) involved.
 Interrogate a violation using the Board Insight pop-up.
Selectively Waiving DRC Violations
The software supports the ability to selectly waive any DRC violation. This allows you to effectively 'suppress' a violation that is considered not to be an issue, without having to craft a special (and maybe complex) design rule to facilitate the design situation.
Waiving a DRC Violation
DRC violations can be waived by:
- Selecting the required violation(s) in the Messages panel, right-clicking, and choosing the Waive Violation command from the context menu.
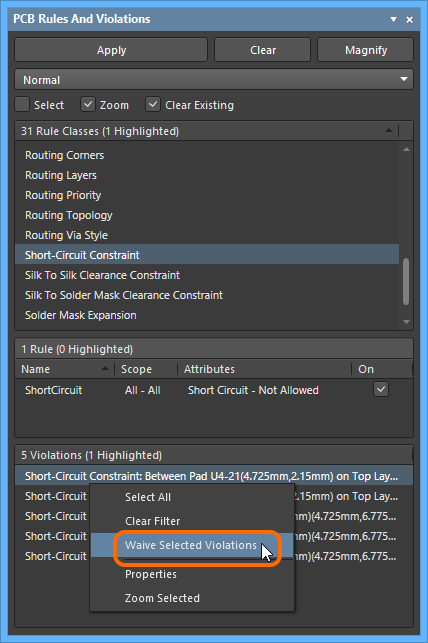
- Selecting the required violation(s) in the Violations region of the PCB Rules and Violations panel, right-clicking, and choosing the Waive Selected Violations command from the context menu.
- Enabling the Waive this violation option in the Violations Details dialog. This dialog appears when you either double-click on a violation in the PCB Rules and Violations panel, or interrogate a violation directly in the workspace, as discussed previously.

Against each waived violation, the software records three pieces of information. When waiving from the Messages panel or PCB Rules And Violations panel, this information is entered in the Waived Violation Info dialog. In the Violation Details dialog, fields for this information are available once the Waive this violation option is enabled.
 Information that is stored for a waived violation is entered either through the Waived Violation Info dialog, or the Violation Details dialog.
Information stored for a waived violation:
- Created At - date and time that the violation was waived.
- Author - if you are signed in to a managed content server, this field is automatically populated with the first and last names of the user currently signed in, and the value cannot be edited. If you are not currently signed in to a managed content server, this field is populated with the first and last names of the Sign In Account currently being used for this seat of the software. In this situation the field can be edited.
- Reason - use this field to enter an optional reason as to why the violation is being waived.
Note that these edits apply to all of the selected violations that are being waived.
Working with Waived Violations
Waived violations are listed in the lower section of the PCB Rules and Violations panel, as shown in the image below. Note that this section only appears when there are waived violations present in the design.
 Violations that have been waived are listed in the PCB Rules And Violations panel.
Click on a waived violation entry to jump to that violation in the workspace (provided the Zoom option is enabled at the top of the panel). Double-click to both jump to the violation (provided Zoom option enabled) and access the Violation Details dialog with the violation presented.
The waived status for a violation can be revoked at any time by:
- Right-clicking on the entry for the violation - in the Waived Violations region of the PCB Rules And Violations panel - and choosing the Unwaive Selected Violations command from the context menu.
- Accessing the Violation Details dialog for the waived violation, and disabling the Waive this violation option.
In the PCB Rules And Violations panel, a waived violation that is unwaived will be removed from the Waived Violations region of the panel, and appear listed in the Violations region.
Documenting Waived Violations
Waived violations are also reported as part of a generated Design Rule Verification Report - provided the option to Create Report File is enabled in the Design Rule Checker dialog.
 All the detail for each waived violation is recorded in the Design Rule Verification Report.
 All the detail for each waived violation is recorded in the Design Rule Verification Report.
DRC Validation in an Output Job
Altium Designer provides the ability to define and run a DRC validation report as part of an Output Job Configuration file (*.OutJob). With an OutJob file open as the active document, the report is available from the Validation Outputs grouping of outputs. To add a report, simply click the [Add New Validation Output] control and choose the Design Rules Check entry, selecting the PCB document as the source.
 Add a DRC validation report to an Output Job file.
Validation as Part of PCB Design Release
Using validation reports defined in an assigned Output Job file, the software provides the ability to validate designs as an integral part of its board design release process. These validation checks will be performed on every release, and the release will fail if any validation checks are not passed successfully. Validation is run at the Validate Project stage within the Release view, with results available at the Review Data stage.
 Example of successful validation being run within the Release view, for fabrication and assembly data sets.
 Example of successful validation being run within the Release view, for fabrication and assembly data sets.