
Project Overview Dashboards
Created: January 23, 2025 | Updated: February 04, 2025
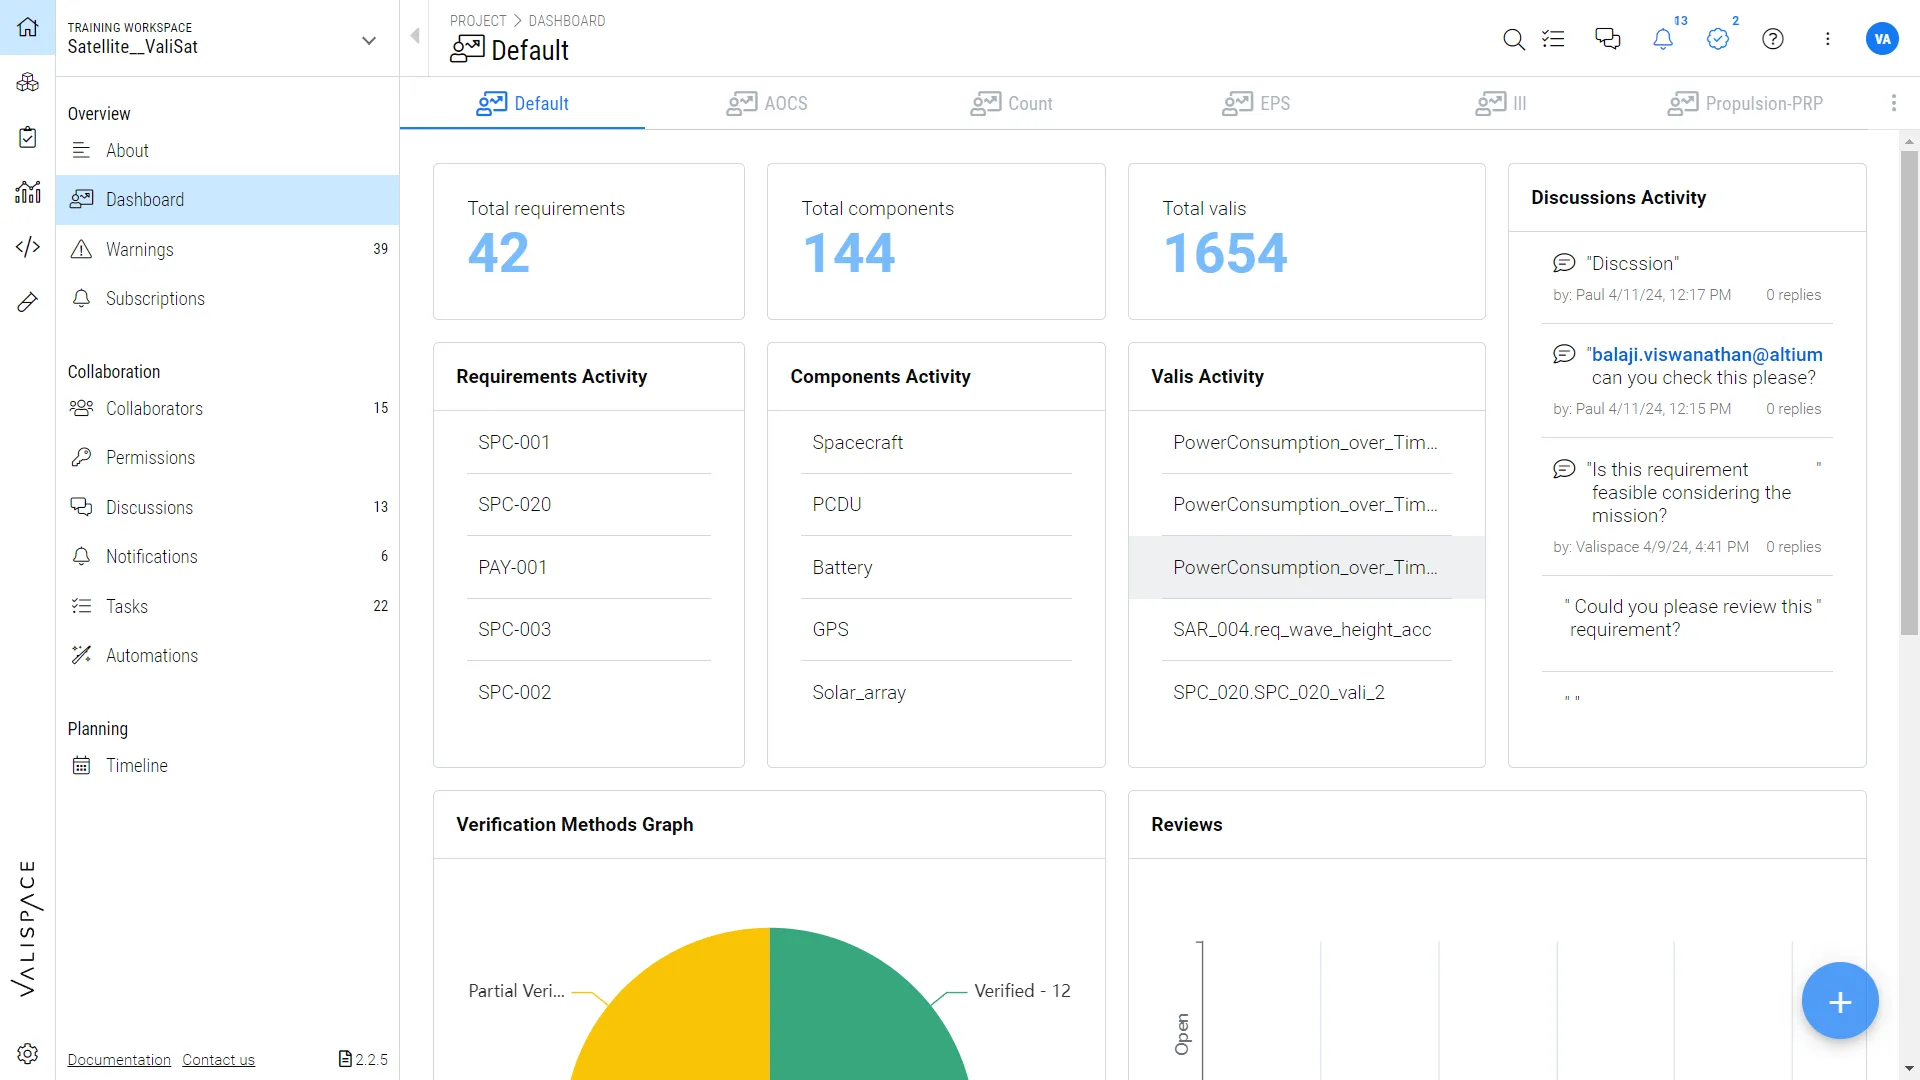 Dashboards for project overview
Project Module Dashboards allow your team to work in a user-friendly environment with a series of visual elements that empower data through its visualization and enhance data-driven decisions.
Dashboards allow you to:
-
Visualize data from any module
-
Keep your team on track with highly customizable dashboards
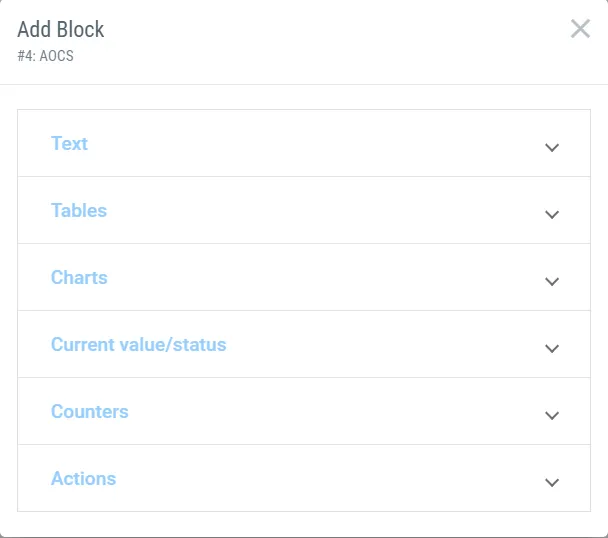
You can create as many Dashboards as you wish, each with its own purpose and data.
Some of the most common data you can find on Dashboards:
-
Budget charts
-
Key Blocks' properties such as cost and mass
-
List of pertinent Requirements, Analysis or Tests
-
External links
-
Files
For more information on Dashboards, You can refer to our documentation here.