The States With the Most
Future-Proof Workforces
The future of the workplace may seem ambiguous, but some jobs are better positioned than others for the changes already underway. Today’s job market is undergoing one of the most rapid technological transformations in history, with new technologies upheaving entire industries, altering the skills employers require, and creating new career opportunities in the process. While no one can predict exactly what the job market will look like decades from now, the current trajectory of fields like engineering, software development, data science, semiconductor technology, automation, advanced manufacturing, and renewable energy offers some insights into where it may be headed.
To determine which states are best prepared for the future, Altium analyzed employment growth, wage growth, business expansion, and research and development (R&D) in science and engineering nationwide to identify the states with the most future-proof workforces.
Embed this infographic — copy the embed code to share it on your site, with attribution back to Altium:
What Makes a Workforce Future-Proof?
For our purposes, a future-proof workforce is defined by a large share of workers in sectors expected to be vital to the economy in the years ahead. To evaluate this, we analyzed 30 occupations from the Bureau of Labor Statistics’ Occupational Employment and Wage Statistics. These roles include software development, data science, engineering, electronics, semiconductor technology, automation, advanced manufacturing, and renewable energy. We then ranked these occupations based on several factors.
States were assessed using seven metrics covering current workforce strength, employment growth, earning potential, business activity, education, and research investment. Each state received a final score of up to 100 and was ranked from highest to lowest. The proportion of workers in future-focused occupations was the most heavily weighted factor at 25%, followed by employment growth in those roles at 15% and median salaries at 10%.
Beyond individual workers, we also examined the concentration and growth of future-tech industries, prioritizing the private sector to better capture the true commercial technology ecosystem. The share of private future-proof businesses in these industries accounted for 20% of the score, while five-year business growth accounted for 15%. Science and engineering degrees accounted for 5% of the score, and R&D as a share of state GDP accounted for 10%. In cases where occupational or industry classifications changed between 2020 and 2025, equivalent 2020 codes were used to calculate growth.
States Leading in Future-Proof Workforces
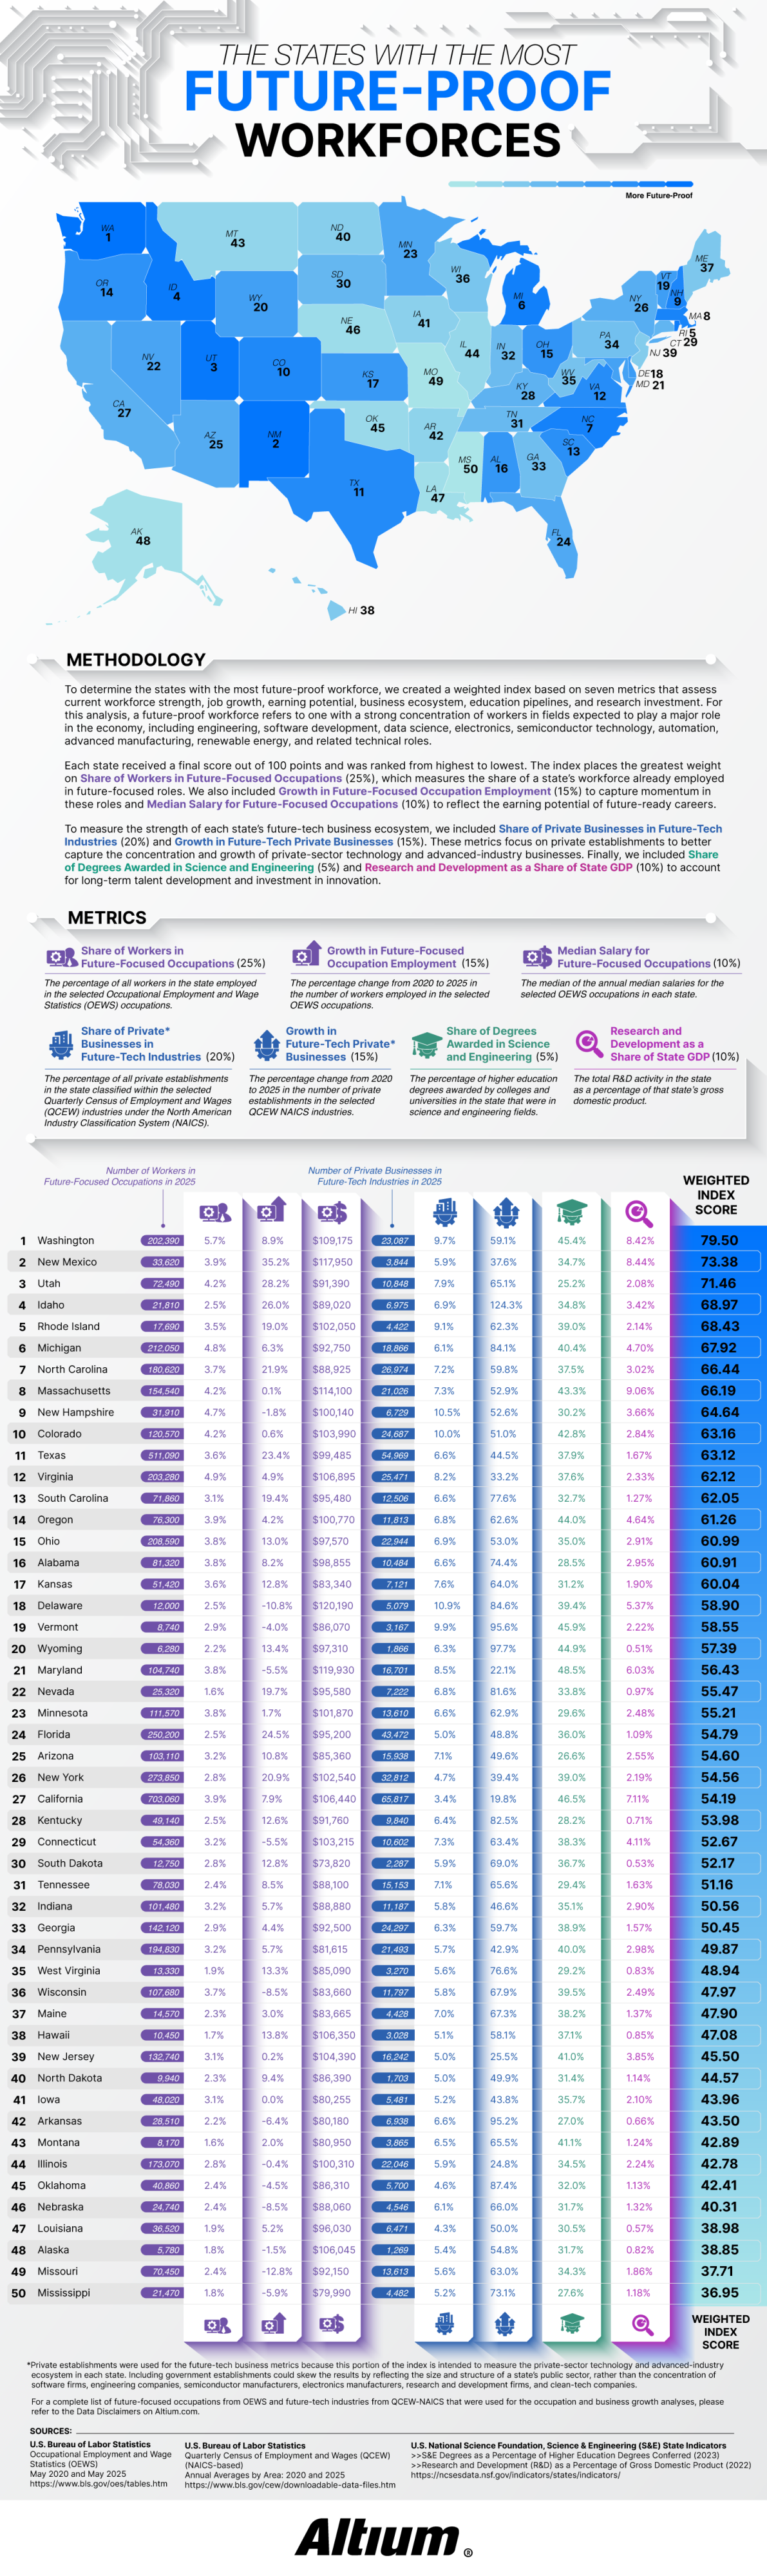
Washington topped the list with a score of 79.50, earning its place as the state with the best tech employment in the country. Nearly 6% of the state’s workforce already works in future-focused occupations, drawing a median salary of $109,175. The state’s future-tech businesses grew by 59.1% over five years. Washington’s strength likely stems from a high number of established aerospace and software employers. The state leads the nation in aerospace sales, exports, employment, and labor productivity, indicating it already has a strong culture around one of the most future-proof occupations in our analysis.
Surprisingly, the top five states are not all traditional coastal tech hubs, as New Mexico takes second place thanks to its massive employment growth. At 35.2%, New Mexico leads the nation in future-focused occupation expansion. The presence of major national laboratories and a growing aerospace sector likely contributes to its projected expansion, creating a large STEM workforce.
Interestingly, the states with a reputation for the best tech employment environments are not necessarily those with the most technology workers. California, for example, has 703,060 workers in future-focused occupations, more than any other state in the analysis, yet it ranks 27th overall. Although California excels in science and engineering education and R&D, future-tech industries account for just 3.4% of its private businesses, and its five-year business growth was the lowest in the country at 19.8%.
In contrast, smaller states can rank highly when future-focused activities make up a larger share of their economies. Rhode Island ranks fifth, with 9.1% of private businesses operating in future-tech industries and 62.3% growth in those businesses. New Hampshire, ranked ninth, has the highest share of private businesses in future-tech industries among the top ten, at 10.5%.
As we advance toward a more tech-centered future, states with STEM-based economies are likely to attract the most skilled workforces. However, gaining access to top-tier engineering talent is only half the battle. As engineering and electronics continue to shape the next generation of products and industries, the tools that turn ideas into working technology are increasingly important. Altium provides electronic design automation solutions that assist engineers in designing printed circuit boards and bring complex electronics from concept to production. If your team is ready to streamline its design process and tackle the most advanced hardware challenges, contact Altium today to equip your engineers for the future of your industry.
States Ranked by Future-Proof Occupation Prospects
Methodology
To determine the states with the most future-proof workforce, we created a weighted index based on seven metrics that assess current workforce strength, job growth, earning potential, business ecosystem, education pipelines, and research investment. For this analysis, a future-proof workforce refers to one with a strong concentration of workers in fields expected to play a major role in the economy, including engineering, software development, data science, electronics, semiconductor technology, automation, advanced manufacturing, renewable energy, and related technical roles.
Each state received a final score out of 100 points and was ranked from highest to lowest. The index places the greatest weight on Share of Workers in Future-Focused Occupations (25%), which measures the share of a state’s workforce already employed in future-focused roles. We also included Growth in Future-Focused Occupation Employment (15%) to capture momentum in these roles and Median Salary for Future-Focused Occupations (10%) to reflect the earning potential of future-ready careers.
To measure the strength of each state’s future-tech business ecosystem, we included Share of Private Businesses in Future-Tech Industries (20%) and Growth in Future-Tech Private Businesses (15%). These metrics focus on private establishments to better capture the concentration and growth of private-sector technology and advanced-industry businesses. Finally, we included Share of Degrees Awarded in Science and Engineering (5%) and Research and Development as a Share of State GDP (10%) to account for long-term talent development and investment in innovation.
Metrics
- Share of Workers in Future-Focused Occupations (25%) – The percentage of all workers in the state employed in the selected Occupational Employment and Wage Statistics (OEWS) occupations.
- Growth in Future-Focused Occupation Employment (15%) – The percentage change from 2020 to 2025 in the number of workers employed in the selected OEWS occupations.
- Median Salary for Future-Focused Occupations (10%) – The median of the annual median salaries for the selected OEWS occupations in each state.
- Share of Private* Businesses in Future-Tech Industries (20%) – The percentage of all private establishments in the state classified within the selected Quarterly Census of Employment and Wages (QCEW) industries under the North American Industry Classification System (NAICS).
- Growth in Future-Tech Private* Businesses (15%) – The percentage change from 2020 to 2025 in the number of private establishments in the selected QCEW NAICS industries.
- Share of Degrees Awarded in Science and Engineering (5%) – The percentage of higher education degrees awarded by colleges and universities in the state that were in science and engineering fields.
- Research and Development as a Share of State GDP (10%) – The total R&D activity in the state as a percentage of that state’s gross domestic product.
| Rank | State | Number of Workers in Future-Focused Occupations | Share of Workers in Future-Focused Occupations | Growth in Future-Focused Occupation Employment | Median Salary for Future-Focused Occupations | Number of Private Businesses in Future-Tech Industries | Share of Private Businesses in Future-Tech Industries | Growth in Future-Tech Private Businesses | Share of Degrees Awarded in Science and Engineering | Research and Development as a Share of State GDP | Weighted Index Score |
|---|---|---|---|---|---|---|---|---|---|---|---|
| 1 | Washington | 202,390 | 5.7% | 8.9% | $109,175 | 23,087 | 9.7% | 59.1% | 45.4% | 8.42% | 79.50 |
| 2 | New Mexico | 33,620 | 3.9% | 35.2% | $117,950 | 3,844 | 5.9% | 37.6% | 34.7% | 8.44% | 73.38 |
| 3 | Utah | 72,490 | 4.2% | 28.2% | $91,390 | 10,848 | 7.9% | 65.1% | 25.2% | 2.08% | 71.46 |
| 4 | Idaho | 21,810 | 2.5% | 26.0% | $89,020 | 6,975 | 6.9% | 124.3% | 34.8% | 3.42% | 68.97 |
| 5 | Rhode Island | 17,690 | 3.5% | 19.0% | $102,050 | 4,422 | 9.1% | 62.3% | 39.0% | 2.14% | 68.43 |
| 6 | Michigan | 212,050 | 4.8% | 6.3% | $92,750 | 18,866 | 6.1% | 84.1% | 40.4% | 4.70% | 67.92 |
| 7 | North Carolina | 180,620 | 3.7% | 21.9% | $88,925 | 26,974 | 7.2% | 59.8% | 37.5% | 3.02% | 66.44 |
| 8 | Massachusetts | 154,540 | 4.2% | 0.1% | $114,100 | 21,026 | 7.3% | 52.9% | 43.3% | 9.06% | 66.19 |
| 9 | New Hampshire | 31,910 | 4.7% | -1.8% | $100,140 | 6,729 | 10.5% | 52.6% | 30.2% | 3.66% | 64.64 |
| 10 | Colorado | 120,570 | 4.2% | 0.6% | $103,990 | 24,687 | 10.0% | 51.0% | 42.8% | 2.84% | 63.16 |
| 11 | Texas | 511,090 | 3.6% | 23.4% | $99,485 | 54,969 | 6.6% | 44.5% | 37.9% | 1.67% | 63.12 |
| 12 | Virginia | 203,280 | 4.9% | 4.9% | $106,895 | 25,471 | 8.2% | 33.2% | 37.6% | 2.33% | 62.12 |
| 13 | South Carolina | 71,860 | 3.1% | 19.4% | $95,480 | 12,506 | 6.6% | 77.6% | 32.7% | 1.27% | 62.05 |
| 14 | Oregon | 76,300 | 3.9% | 4.2% | $100,770 | 11,813 | 6.8% | 62.6% | 44.0% | 4.64% | 61.26 |
| 15 | Ohio | 208,590 | 3.8% | 13.0% | $97,570 | 22,944 | 6.9% | 53.0% | 35.0% | 2.91% | 60.99 |
| 16 | Alabama | 81,320 | 3.8% | 8.2% | $98,855 | 10,484 | 6.6% | 74.4% | 28.5% | 2.95% | 60.91 |
| 17 | Kansas | 51,420 | 3.6% | 12.8% | $83,340 | 7,121 | 7.6% | 64.0% | 31.2% | 1.90% | 60.04 |
| 18 | Delaware | 12,000 | 2.5% | -10.8% | $120,190 | 5,079 | 10.9% | 84.6% | 39.4% | 5.37% | 58.90 |
| 19 | Vermont | 8,740 | 2.9% | -4.0% | $86,070 | 3,167 | 9.9% | 95.6% | 45.9% | 2.22% | 58.55 |
| 20 | Wyoming | 6,280 | 2.2% | 13.4% | $97,310 | 1,866 | 6.3% | 97.7% | 44.9% | 0.51% | 57.39 |
| 21 | Maryland | 104,740 | 3.8% | -5.5% | $119,930 | 16,701 | 8.5% | 22.1% | 48.5% | 6.03% | 56.43 |
| 22 | Nevada | 25,320 | 1.6% | 19.7% | $95,580 | 7,222 | 6.8% | 81.6% | 33.8% | 0.97% | 55.47 |
| 23 | Minnesota | 111,570 | 3.8% | 1.7% | $101,870 | 13,610 | 6.6% | 62.9% | 29.6% | 2.48% | 55.21 |
| 24 | Florida | 250,200 | 2.5% | 24.5% | $95,200 | 43,472 | 5.0% | 48.8% | 36.0% | 1.09% | 54.79 |
| 25 | Arizona | 103,110 | 3.2% | 10.8% | $85,360 | 15,938 | 7.1% | 49.6% | 26.6% | 2.55% | 54.60 |
| 26 | New York | 273,850 | 2.8% | 20.9% | $102,540 | 32,812 | 4.7% | 39.4% | 39.0% | 2.19% | 54.56 |
| 27 | California | 703,060 | 3.9% | 7.9% | $106,440 | 65,817 | 3.4% | 19.8% | 46.5% | 7.11% | 54.19 |
| 28 | Kentucky | 49,140 | 2.5% | 12.6% | $91,760 | 9,840 | 6.4% | 82.5% | 28.2% | 0.71% | 53.98 |
| 29 | Connecticut | 54,360 | 3.2% | -5.5% | $103,215 | 10,602 | 7.3% | 63.4% | 38.3% | 4.11% | 52.67 |
| 30 | South Dakota | 12,750 | 2.8% | 12.8% | $73,820 | 2,287 | 5.9% | 69.0% | 36.7% | 0.53% | 52.17 |
| 31 | Tennessee | 78,030 | 2.4% | 8.5% | $88,100 | 15,153 | 7.1% | 65.6% | 29.4% | 1.63% | 51.16 |
| 32 | Indiana | 101,480 | 3.2% | 5.7% | $88,880 | 11,187 | 5.8% | 46.6% | 35.1% | 2.90% | 50.56 |
| 33 | Georgia | 142,120 | 2.9% | 4.4% | $92,500 | 24,297 | 6.3% | 59.7% | 38.9% | 1.57% | 50.45 |
| 34 | Pennsylvania | 194,830 | 3.2% | 5.7% | $81,615 | 21,493 | 5.7% | 42.9% | 40.0% | 2.98% | 49.87 |
| 35 | West Virginia | 13,330 | 1.9% | 13.3% | $85,090 | 3,270 | 5.6% | 76.6% | 29.2% | 0.83% | 48.94 |
| 36 | Wisconsin | 107,680 | 3.7% | -8.5% | $83,660 | 11,797 | 5.8% | 67.9% | 39.5% | 2.49% | 47.97 |
| 37 | Maine | 14,570 | 2.3% | 3.0% | $83,665 | 4,428 | 7.0% | 67.3% | 38.2% | 1.37% | 47.90 |
| 38 | Hawaii | 10,450 | 1.7% | 13.8% | $106,350 | 3,028 | 5.1% | 58.1% | 37.1% | 0.85% | 47.08 |
| 39 | New Jersey | 132,740 | 3.1% | 0.2% | $104,390 | 16,242 | 5.0% | 25.5% | 41.0% | 3.85% | 45.50 |
| 40 | North Dakota | 9,940 | 2.3% | 9.4% | $86,390 | 1,703 | 5.0% | 49.9% | 31.4% | 1.14% | 44.57 |
| 41 | Iowa | 48,020 | 3.1% | 0.0% | $80,255 | 5,481 | 5.2% | 43.8% | 35.7% | 2.10% | 43.96 |
| 42 | Arkansas | 28,510 | 2.2% | -6.4% | $80,180 | 6,938 | 6.6% | 95.2% | 27.0% | 0.66% | 43.50 |
| 43 | Montana | 8,170 | 1.6% | 2.0% | $80,950 | 3,865 | 6.5% | 65.5% | 41.1% | 1.24% | 42.89 |
| 44 | Illinois | 173,070 | 2.8% | -0.4% | $100,310 | 22,046 | 5.9% | 24.8% | 34.5% | 2.24% | 42.78 |
| 45 | Oklahoma | 40,860 | 2.4% | -4.5% | $86,310 | 5,700 | 4.6% | 87.4% | 32.0% | 1.13% | 42.41 |
| 46 | Nebraska | 24,740 | 2.4% | -8.5% | $88,060 | 4,546 | 6.1% | 66.0% | 31.7% | 1.32% | 40.31 |
| 47 | Louisiana | 36,520 | 1.9% | 5.2% | $96,030 | 6,471 | 4.3% | 50.0% | 30.5% | 0.57% | 38.98 |
| 48 | Alaska | 5,780 | 1.8% | -1.5% | $106,045 | 1,269 | 5.4% | 54.8% | 31.7% | 0.82% | 38.85 |
| 49 | Missouri | 70,450 | 2.4% | -12.8% | $92,150 | 13,613 | 5.6% | 63.0% | 34.3% | 1.86% | 37.71 |
| 50 | Mississippi | 21,470 | 1.8% | -5.9% | $79,990 | 4,482 | 5.2% | 73.1% | 27.6% | 1.18% | 36.95 |
*Private establishments were used for the future-tech business metrics because this portion of the index is intended to measure the private-sector technology and advanced-industry ecosystem in each state. Including government establishments could skew the results by reflecting the size and structure of a state’s public sector, rather than the concentration of software firms, engineering companies, semiconductor manufacturers, electronics manufacturers, research and development firms, and clean-tech companies.
Data Disclaimers
Future-Proof Occupations
The following 30 occupation titles were included in the analysis from the Occupational Employment and Wage Statistics (OEWS):
- Information Security Analysts
- Computer and Information Research Scientists
- Database Architects*
- Network and Computer Systems Administrators
- Computer Programmers
- Software Developers*
- Data Scientists*
- Chemical Engineers
- Computer Hardware Engineers
- Electrical Engineers
- Electronics Engineers (except Computer)
- Industrial Engineers
- Materials Engineers
- Mechanical Engineers
- Engineers (All Other)
- Electrical and Electronic Engineering Technologists and Technicians
- Electro-Mechanical and Mechatronics Technologists and Technicians
- Industrial Engineering Technologists and Technicians
- Mechanical Engineering Technologists and Technicians
- Engineering Technologists and Technicians (except Drafters, All Other)*
- Chemists
- Materials Scientists
- Solar Photovoltaic Installers
- Electrical and Electronics Repairers (Commercial and Industrial Equipment)
- Industrial Machinery Mechanics
- Wind Turbine Service Technicians
- Electrical, Electronic, and Electromechanical Assemblers (except Coil Winders, Tapers, and Finishers)
- Semiconductor Processing Technicians
- Computer Numerically Controlled Tool Operators
- Computer Numerically Controlled Tool Programmers
*The equivalent OEWS code from 2020 was slightly different, and the following 2020 occupation codes were used in the 5-year growth metrics:
Database Administrators and Architects, Software Developers and Software Quality Assurance Analysts and Testers, Data Scientists and Mathematical Science Occupations (All Other), and Calibration Technologists and Technicians and Engineering Technologists and Technicians (except Drafters, All Other).
Future-Tech Industries
The following 27 industries were included in the analysis from the Quarterly Census of Employment and Wages (QCEW) North American Industry Classification System (NAICS):
- Hydroelectric Power Generation
- Solar Electric Power Generation
- Wind Electric Power Generation
- Geothermal Electric Power Generation
- Biomass Electric Power Generation
- All Other Industrial Machinery and Equipment Manufacturing
- Turbine and Turbine Generator Set Units Manufacturing
- Semiconductor and Related Device Manufacturing
- Capacitor, Resistor, Coil, Transformer, and Other Inductor Manufacturing
- Electronic Connector Manufacturing
- Printed Circuit Assembly / Electronic Assembly Manufacturing
- Other Electronic Component Manufacturing
- Search, Detection, Navigation, Guidance, Aeronautical, and Nautical System and Instrument Manufacturing
- Automatic Environmental Control Manufacturing
- Instrument Manufacturing for Measuring and Testing Electricity and Electrical Signals
- Power, Distribution, and Specialty Transformer Manufacturing
- Motor and Generator Manufacturing
- Relay and Industrial Control Manufacturing
- Aerospace Product and Parts Manufacturing
- Medical Equipment and Supplies Manufacturing
- Software Publishers
- Computing Infrastructure Providers
- Data Processing, Web Hosting, and Related Services*
- Engineering Services
- Custom Computer Programming Services
- Computer Systems Design Services
- Research and Development in Nanotechnology, and Research and Development in the Physical, Engineering, and Life Sciences.
*The equivalent NAICS code from 2020 was slightly different, and the following industry was used in the 5-year growth metrics: Data Processing, Hosting, and Related Services.
Sources
U.S. Bureau of Labor Statistics
Occupational Employment and Wage Statistics (OEWS)
May 2020 and May 2025
https://www.bls.gov/oes/tables.htm
U.S. Bureau of Labor Statistics
Quarterly Census of Employment and Wages (QCEW) (NAICS-based)
Annual Averages by Area: 2020 and 2025
https://www.bls.gov/cew/downloadable-data-files.htm
U.S. National Science Foundation, Science & Engineering (S&E) State Indicators
— S&E Degrees as a Percentage of Higher Education Degrees Conferred (2023)
— Research and Development (R&D) as a Percentage of Gross Domestic Product (2022)