Find Cost Savings
and Smarter
Sourcing Strategies
Manual quotes, distributor portals, and spreadsheets make
it hard to uncover savings opportunities. Enterprise sourcing
teams use Altium Sourcing to find millions in direct material
savings. Use our calculator to find yours.
Try Our Savings Calculator.
Move the sliders below to see how much your organization could save annually on alternate parts,
distributor pricing, contract compliance, and risk avoidance, tailored to your organization’s spend.
*All data provided is anonymized and not saved by Altium Sourcing or its parent companies. Estimates above are based on Altium Sourcing customer outcomes across their electronics and electro-mechanical spend.
How we calculated this
Three primary inputs, drawn from how direct materials savings actually break down in practice.
1. Savings rates vary by component category.
Electronics have the most headroom — distributor pricing is volatile and alternates are abundant. Custom and strategic parts have the least, since substitution isn't really on the table.
| Category | Achievable savings | Why |
|---|---|---|
| Electronics | 12–18% | Active distributor markets, alternates, price volatility |
| Mechanical | 5–10% | Fewer drop-in alternates, more tooling lock-in |
| Raw materials | 3–7% | Commodity pricing, limited optimization levers |
| Custom / strategic | 4–8% | Negotiation leverage rather than substitution |
2. Your starting point matters.
Teams running on spreadsheets and email leave more on the table than teams already running a sourcing tool. We apply a maturity multiplier that adjusts the savings range based on how mature your current process is.
3. Savings come from four levers
In roughly these proportions across our customer base. The breakdown shapes how the platform prioritizes recommendations and how quickly different savings categories materialize.

You’ve seen your
potential savings.
Now see the exact
framework we used to
uncover them.
See the framework behind your estimate — part
mix calculations, maturity multipliers, and the
four savings levers — with worked examples of
customer use cases showing how they captured
over 95% productivity gains, realized 10% cost
savings, and resolved critical supply shortages
in under 6 months.
Get Full Methodology and Case Studies
Savings Powered by Strategic
Sourcing Intelligence
Altium Sourcing ingests, normalizes, and connects sourcing data — contract pricing, distributor quotes,
component lifecycle signals, and approved alternates — to surface savings that spreadsheets simply can’t see.
Real-Time Distributor Pricing Intelligence

Compare your contract pricing against live distributor pricing from authorized sources. Identify gaps between what you’re paying and what the market offers at all levels: component, PCBA, or category.
AI-Powered Alternate Identification

Automatically surface qualified alternate components across your BOM, cross-referenced against form, fit, function, and compliance requirements. No more manual datasheet comparisons.
Contract Compliance Gap Analysis

See exactly where you’re overpaying. Compare contract pricing to live authorized distributor pricing and uncover savings opportunities across your BOM and component portfolio.
Supply Risk Scoring

Get ahead of obsolescence, single-source dependencies, and lead-time volatility before they become production-stopping problems. Prioritize mitigation by financial impact, not guesswork.

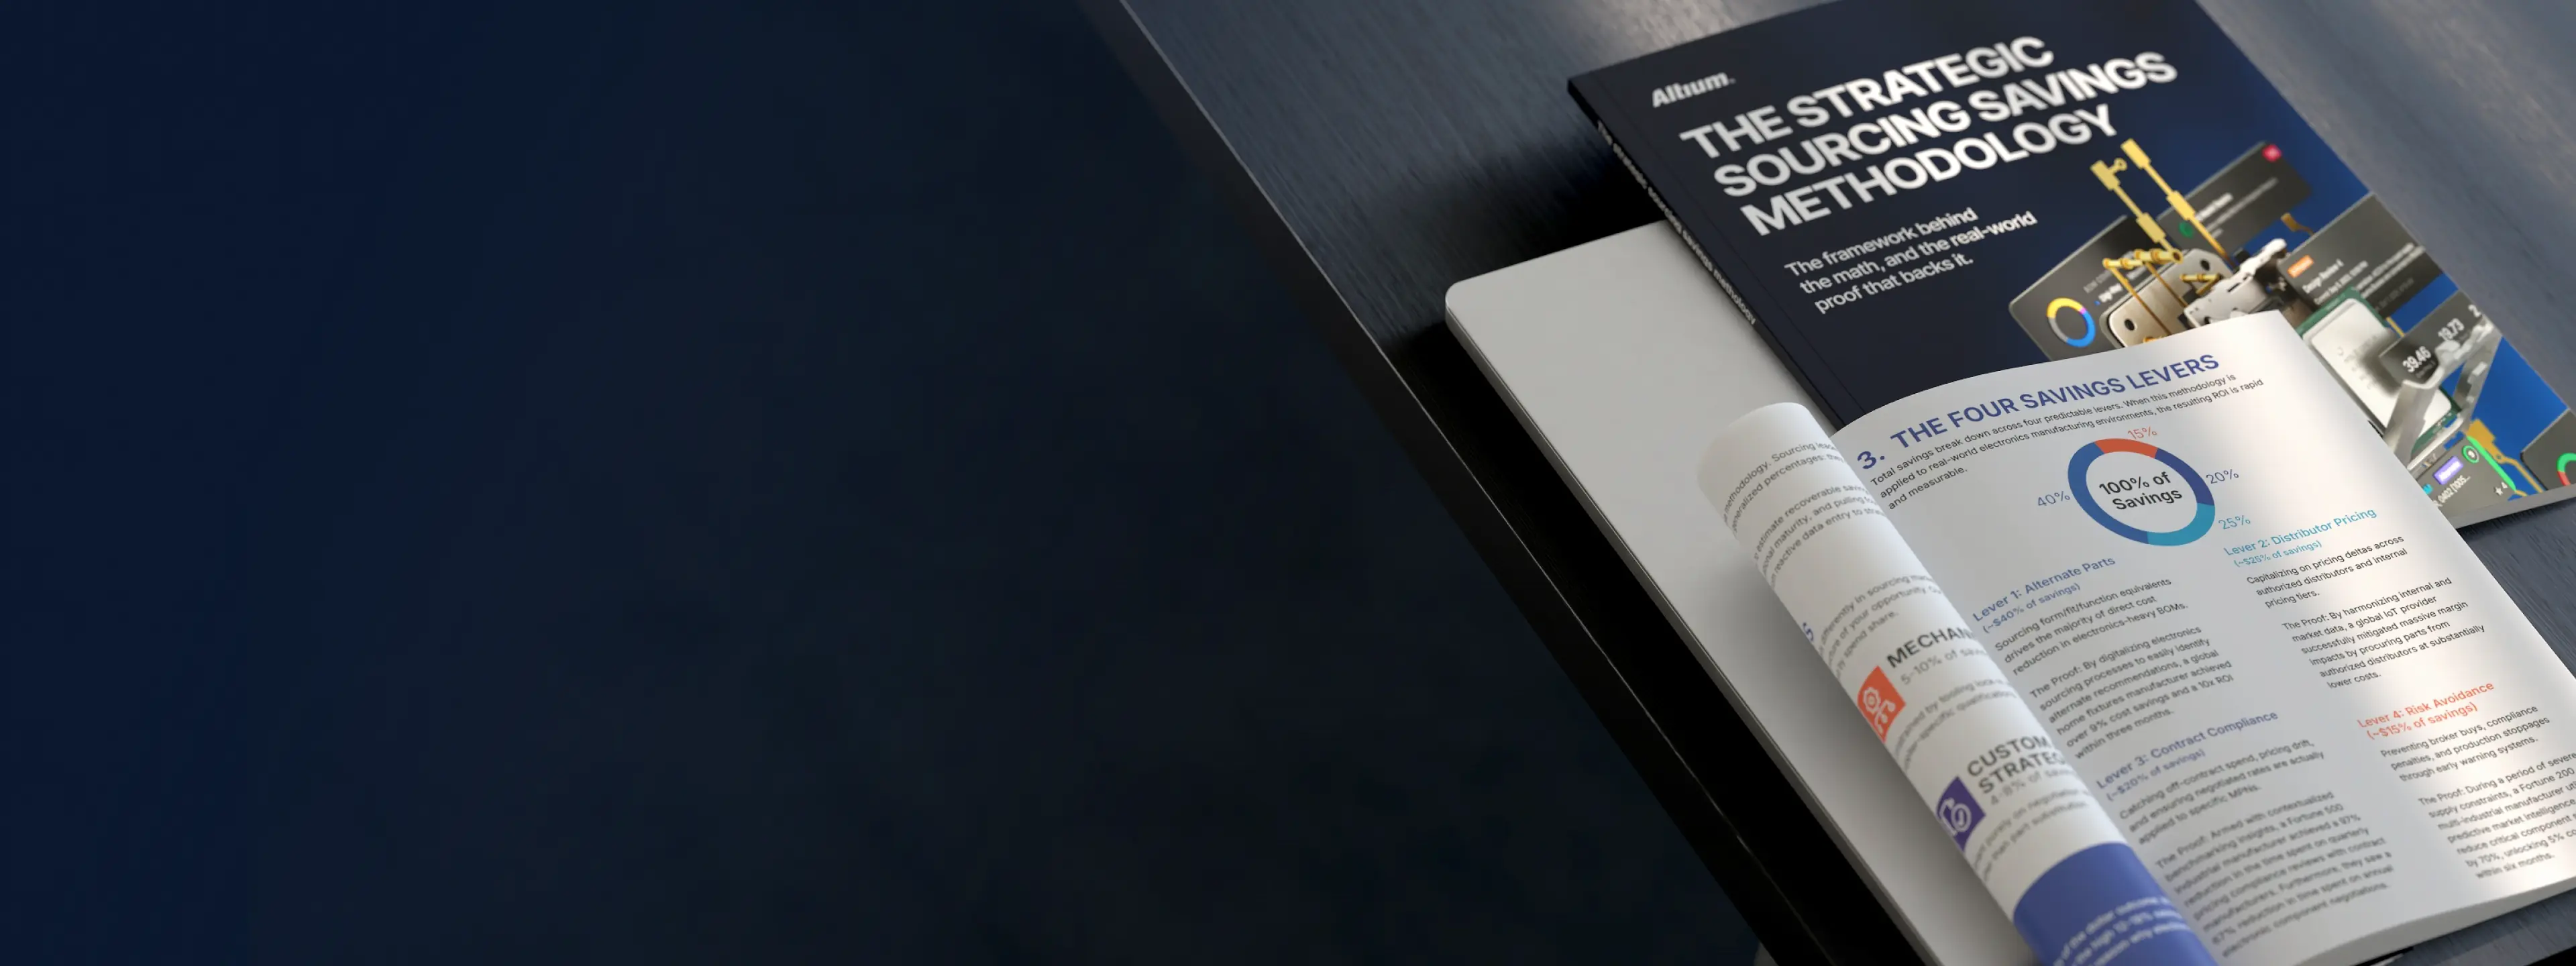
Get the Methodology Brief
The calculator gave you the estimate. Our Savings
Methodology Brief shows you exactly how it works
What’s included:
- The complete methodology of electronics sourcing savings with worked examples for each savings lever
- How to apply our maturity multipliers to your situation
- What 97% sourcing-team productivity gains look like in practice