
ワークスペースコンポーネント
Workspaceでは、そのWorkspace内に現在保存されているすべての管理対象コンポーネントを、簡単に参照できます。Workspaceブラウザーインターフェース(親となるAltium 365 Platform Interfaceの構成要素の1つ)からアクセスすることで、現在利用可能なコンポーネントの内容と数量をすばやく確認できるだけでなく、それらのコンポーネントの健全性の概要も確認できます。さらに詳細を確認したい場合は、専用のLibrary Health dashboardから、コンポーネントの健全性に関するより詳しい情報を参照できます。これにより、問題をより詳細に把握し、適切に評価・修正できます。
コンポーネントへのアクセス
管理対象コンポーネントには、Workspaceブラウザーインターフェースの Library – Components ページからアクセスします。このページは3つの領域で構成されており、以下の画像およびその後の説明に示されています。
 WorkspaceブラウザーインターフェースのComponentsページから、現在Workspace内で利用可能な管理対象コンポーネントを参照できます。Library Health領域には、コンポーネントとその健全性の概要が表示されます。
- Library Health – このページ領域には、直近のヘルスチェック実行時点でのコンポーネントの健全性概要が表示されます。詳細なLibrary Healthダッシュボードページにアクセスでき、そこからヘルスチェックを実行したり、コンポーネントの健全性に関する問題をより詳細に確認したりできます。
-
Components – このページに最初にアクセスすると、この領域にはさまざまなコンポーネントタイプがタイル表示され、それぞれのタイプごとの既存コンポーネント総数も示されます。ここから、個々のコンポーネントをさらに掘り下げて表示し、詳細情報を確認できます。
-
Supply Chain Data Sources – このページ領域には、使用されているサプライチェーンデータソースが一覧表示されます。データソースには、Octopart、IHS Markit®、SiliconExpertのようなその他のデータソース、および社内の部品データベースを使用できます。これらのソースの詳細については、https://www.altium.com/capabilities/supply-chain
コンポーネントの参照
最初にアクセスすると、Components ページにはWorkspace内のコンポーネントの概要がタイプ別に表示されます。タイルをクリックすると、そのタイプに属するすべてのコンポーネントのフラットな一覧が表示されます。この一覧は、ページ左上のドロップダウンからコンポーネントタイプを選択して表示することもできます。特定のコンポーネントがどのカテゴリタイプに分類されるかは、そのComponent Typeパラメータによって決まります。このパラメータは、コンポーネントの作成時または編集時、あるいはコンポーネントがWorkspaceにインポートされる際に指定されます。詳細については、Building & Maintaining Your Components and Librariesを参照してください。
 Workspaceでダイオードタイプのすべてのコンポーネントを参照している例。
コンポーネントエントリを選択すると、以下の画像と一覧のように、右側のペインにその詳細情報が表示されます。
 コンポーネントエントリを選択すると、右側のペインに詳細情報が読み込まれます。
-
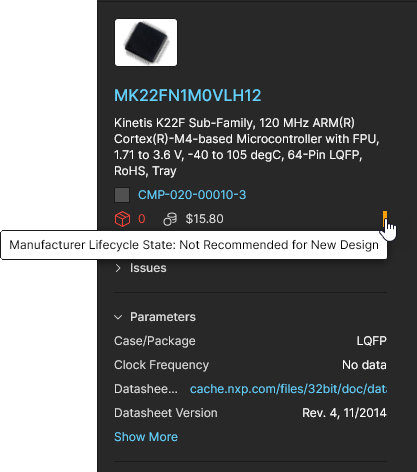
コンポーネント名(Octopartへのリンク)と説明。
-
リビジョン状態アイコン(色によって
Draft、Productionなど)とリビジョンID(Component viewへのリンク)。 -
在庫状況と中央値価格、さらにメーカーのライフサイクル状態を示す色付きアイコン(右側)– このアイコンにカーソルを合わせると追加情報が表示されます。
 追加の部品ソース(SiliconExpert etcなど)が有効な場合は、さらに詳しい情報を含むドロップダウンメニューが利用できることがあります(
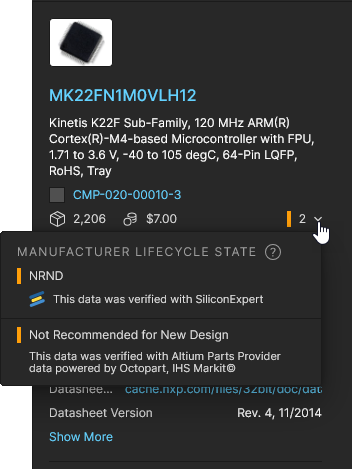 )。
)。
-
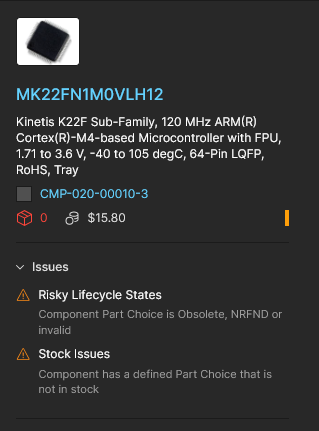
検出されたコンポーネントの供給およびライフサイクル上の問題の一覧(Issues)。
 追加の部品ソース(SiliconExpert etcなど)が有効な場合、その情報はそれらのサービスから取得されます。
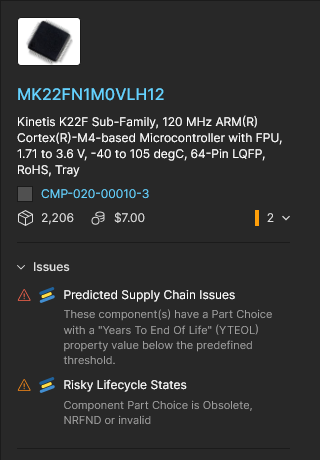 詳細および推奨される解決策については、Library Health Dashboardを参照してください。
-
パラメトリックデータ(Parameters)。
-
モデル – シンボルおよびフットプリント(Models)。
-
参照ドキュメント(利用可能な場合) – データシート、ピン配置など(References)。
-
メーカーのライフサイクル状態の色コードと、サプライヤーの在庫/価格情報を含むPart Choicesエントリ(Part Choices)。追加の部品ソース(
YTEOLSiliconExpert etcなど)が有効な場合、Part Choiceタイルには予測寿命エントリ()も含まれます( )– 必要に応じて、Get Dataオプションを使用して
YTEOLデータを取得してください。 -
Where-used情報 – そのコンポーネントが使用されている場所(設計プロジェクト、管理対象回路図シート、管理対象BOMなど)と、親エンティティへのアクティブリンク(Where Used)。
Component Viewへのアクセス
各コンポーネントエントリについて、選択したコンポーネントを専用ビューアーで開くことができます。このビューアーには、そのアイテムのリビジョンに関連付けられたパラメトリックデータ、モデル、サプライヤー情報が含まれます。このビューは、本質的には右側の(Information)ペインに表示されるコンポーネントデータ情報の拡張版です。選択したコンポーネントのComponentビューを開くには、エントリをダブルクリックするか、関連するOpenメニューから![]() オプションを選択します。
オプションを選択します。
 コンポーネントアイテムのエントリをダブルクリックするか、Openメニューオプションを使用して、コンポーネントの読み取り専用ビューにアクセスします。
新しいブラウザータブで開くComponentビューは、選択可能なタブ(Part Choices、Where Usedなど)ごとに関連情報が整理された形式になっており、表示する特定のコンポーネントリビジョンも選択できます(Revisionドロップダウンメニュー)。タブビューに含まれるリンクはアクティブであり、参照先(メーカー/サプライヤーのデータシート、where-usedエンティティなど)を新しいブラウザータブで開きます。


Component viewの追加機能には次のものがあります。
-
Detailed Part Choice data – Part Choiceタイルエントリ内のShow Moreオプションを選択すると、そのメーカー部品に対するサプライヤーオプションの詳細とともに、コンポーネントのパラメータを表示できます。


代替部品エントリに関連付けられた![]() メニューには、その代替部品をこのコンポーネントの新しいPart Choiceエントリとして追加する、または既存のPart Choiceエントリをこの代替部品で置き換えるためのオプションがあります。詳細は以下を参照してください。Part Choicesの詳細について説明しています。
メニューには、その代替部品をこのコンポーネントの新しいPart Choiceエントリとして追加する、または既存のPart Choiceエントリをこの代替部品で置き換えるためのオプションがあります。詳細は以下を参照してください。Part Choicesの詳細について説明しています。

-
Altium 365 SiliconExpert Integrationが利用可能で、Workspaceで有効化されている場合、Get SiliconExpert Advanced Part Dataオプションを選択することで、その高度なパラメータとデータを詳細なPart Choiceビューで有効にできます。このデータが有効な場合:
-
Part ChoiceタイルのヘッダーにあるDatasheetリンクには、利用可能な場合、SiliconExpertから取得したデータシートへのアクセスが含まれます。
-
Parametersタブには、利用可能な高度なSilicon Expertパラメータ一式も含まれています。表示するにはリストを下へスクロールしてください。利用可能なパラメータは、SiliconExpert拡張機能の設定にあるData Visibility Settingsで指定されます。
-
Alternatesタブには、SiliconExpertが提供する代替部品の候補が含まれており、
 アイコンで示されます。エントリにカーソルを合わせ、関連する
 メニュー(右側)を使用して、その代替部品をPart Choiceとして適用します。
-
追加のPCNタブには、SiliconExpertから取得したPart Change Noticesが一覧表示されます。これは、部品の使用に影響する可能性のある製品、プロセス、または企業の変更について、メーカーが顧客に通知するために発行した通知の時系列リストです。
-


-
同様に、WorkspaceでAltium 365 Z2Data Integrationが利用可能で、かつ有効化されている場合は、Get Z2Data Part Dataオプションを選択することで、その高度なパラメータとデータを詳細なPart Choiceビューで有効にできます。このデータを有効にすると、次のようになります。
-
Part ChoiceタイルのヘッダーにあるDatasheetリンクには、利用可能な場合、Z2Dataから取得したデータシートへのアクセスが含まれます。
-
Parametersタブには、利用可能な高度なZ2Dataパラメータ一式も含まれています。表示するにはリストを下へスクロールしてください。
-
Alternatesタブには、Z2Dataが提供する代替部品の候補が含まれており、
 アイコンで示されます。エントリにカーソルを合わせ、関連するメニュー(右側)を使用して、その代替部品をPart Choiceとして適用します。
-


-
Component Revision access – RevisionドロップダウンメニューからコンポーネントアイテムIDオプションを選択すると、Workspaceコンポーネントの以前のバージョンを表示できます(ID番号の接尾辞で示されます)。関連する
 アイコンは、最新リビジョンを表示していないことを示します。このアイコンは、新しいバージョンが利用可能になった場合にも表示されます(たとえば、コンポーネントが更新された直後など)。
 リビジョンドロップダウンメニューを使用して、現在のコンポーネントの以前のリビジョンを選択して表示できます。このリビジョンは古いものとして扱われます。
Part Choicesの表示/編集
コンポーネントに関連付けられたmanufacturer part choicesは、ComponentビューのPart Choicesタブから表示および編集できるほか、メインのComponentsページでコンポーネントエントリのView/Edit Part Choices ![]() メニューから選択して直接アクセスすることもできます。ビューに表示される各Part Choiceタイルには、取得された在庫レベル、価格、およびメーカー部品情報へのアクティブリンクが含まれます。表示されるPart Choicesのデフォルト順は適合性(コスト、在庫レベルなど)によって決まりますが、星評価を指定して手動で並べ替えることもできます。リストの最上位にある「preferred」エントリが、BOMドキュメント内でそのコンポーネントのPart Choiceとして使用されます。
メニューから選択して直接アクセスすることもできます。ビューに表示される各Part Choiceタイルには、取得された在庫レベル、価格、およびメーカー部品情報へのアクティブリンクが含まれます。表示されるPart Choicesのデフォルト順は適合性(コスト、在庫レベルなど)によって決まりますが、星評価を指定して手動で並べ替えることもできます。リストの最上位にある「preferred」エントリが、BOMドキュメント内でそのコンポーネントのPart Choiceとして使用されます。
 コンポーネントに関連付けられたmanufacturer Part Choicesは追加または削除できます。優先するPart Choiceデータは星評価で決定します。
![]() ボタンを使用して新しいPart Choiceエントリを追加します。メーカー検索ウィンドウには、現在表示しているコンポーネント名がデフォルトで設定されますが、集約されたパラメータ用語や部品番号で他の部品を検索できるよう編集可能です。検索結果に一覧表示されるコンポーネントには、規格準拠(
ボタンを使用して新しいPart Choiceエントリを追加します。メーカー検索ウィンドウには、現在表示しているコンポーネント名がデフォルトで設定されますが、集約されたパラメータ用語や部品番号で他の部品を検索できるよう編集可能です。検索結果に一覧表示されるコンポーネントには、規格準拠(RoHSなど)およびサプライヤの在庫/価格情報を要約した列が含まれます。


適切なエントリの![]() ボタンを選択して選択を確定すると、新しいPart Choiceエントリとして追加されます。Part Choicesリストの先頭に移動したい場合は、最も高い星評価を選択してください。なお、Part Choicesはコンポーネントにassociatedされているため、Part Choicesの変更によって新しいコンポーネントリビジョンが作成されることはありません。
ボタンを選択して選択を確定すると、新しいPart Choiceエントリとして追加されます。Part Choicesリストの先頭に移動したい場合は、最も高い星評価を選択してください。なお、Part Choicesはコンポーネントにassociatedされているため、Part Choicesの変更によって新しいコンポーネントリビジョンが作成されることはありません。


各Part Choiceには、以下を含む追加の管理オプションがあります。
-
Show More – Part Choiceエントリの詳細なparametric and supplier part dataを表示します。
-
Remove Part Choice(
メニュー) – リストからPart Choiceエントリを削除します。
-
Clear Rank(
メニュー) – エントリの現在の星評価を未評価の状態(星未選択)に戻します。
-
Star Ranking – 星アイコンを選択して、そのPart Choiceエントリの優先レベルを設定します。エントリは評価順に自動的に並べ替えられ、最上位のPart ChoiceがこのWorkspaceコンポーネントで使用されるデフォルトになります。


コンポーネントの削除
コンポーネントが配置されているフォルダに対する編集権限があれば、一覧からコンポーネントを削除することもできます。これを行うには、コンポーネントエントリを選択し、その右端にある関連![]() メニューからRemoveコマンドを選び、続いて表示されるウィンドウで削除を確認します。この操作は「ソフト削除」であり、コンポーネントはWorkspaceのTrash areaへ移動されます。
メニューからRemoveコマンドを選び、続いて表示されるウィンドウで削除を確認します。この操作は「ソフト削除」であり、コンポーネントはWorkspaceのTrash areaへ移動されます。
Remove related itemsオプションをチェックすると、コンポーネントの子アイテム(例: シンボル、フットプリントモデル、シミュレーションモデル、データシート)も削除対象にできます。これらのアイテム名を確認するには、ウィンドウの![]() アイコン(
アイコン( )にカーソルを合わせてください。なお、これらのアイテムが他の場所で使用されている場合(1つ以上の他コンポーネントで使用中の場合)は削除できません。
はTrashに移動されます。") Components ページから直接コンポーネントを削除することもできます。これは「ソフト削除」であり、コンポーネント(および該当し許可される関連アイテム)はTrashに移動されます。
Components ページから直接コンポーネントを削除することもできます。これは「ソフト削除」であり、コンポーネント(および該当し許可される関連アイテム)はTrashに移動されます。
![]() ボタンで確定すると、コンポーネントはメイン一覧から削除されます。削除処理に問題がある場合は、その詳細を示すウィンドウが表示されます。たとえば、次のような場合です。
ボタンで確定すると、コンポーネントはメイン一覧から削除されます。削除処理に問題がある場合は、その詳細を示すウィンドウが表示されます。たとえば、次のような場合です。
- コンポーネントに関連付けられたアイテム(シンボル、フットプリントなど)が別のコンポーネントで使用されています。この場合、選択したコンポーネントエントリは削除されますが、他で使用中のそれらのアイテムは削除されません。詳細については、ウィンドウ内の問題エントリにカーソルを合わせてください。

-
選択したコンポーネントは既存のプロジェクト設計で使用されています。これは、そのコンポーネントのWhere Usedエントリで確認できます。この警告は、ウィンドウの
 ボタンで続行することで無視できます(推奨されません)。

正常に削除されたすべてのコンポーネント/アイテムは、インターフェイスのTrash ページで確認できます。なお、表示できるのは自分自身が削除(ソフト削除)したコンポーネントやその他のアイテムのみです。管理者はTrash ページのすべての内容、つまりソフト削除されたすべてのアイテムを確認できます。
削除された(ソフト削除された)コンポーネントに関して考慮すべき点:
- そのコンポーネントは、設計ソフトウェアからもWebインターフェイス内からも利用できなくなります。
- そのコンポーネントが使用されていた場所では、コンポーネントが削除されたことが反映されます。
- コンポーネントはTrash pageから復元または完全削除できます。完全削除は、そのコンポーネントが管理対象の回路図シートまたは設計内で使用されていない場合にのみ可能であり、これはコンポーネントのWhere Used情報に反映されます。
メーカーのデータシートへのアクセス
選択したコンポーネントに有効な Datasheet URL パラメータ( )が含まれている場合、コンポーネントのメーカー製データシートを表示するオプションを利用できます。この場合、コンポーネントエントリの右端にある
 ![]() メニューから Open Datasheet オプションを選択することで、データシートに直接アクセスできます。または、コンポーネントの Properties pane からこの種のリンクを開くこともできます。リンクされたデータシートは新しいブラウザタブで開きます。
メニューから Open Datasheet オプションを選択することで、データシートに直接アクセスできます。または、コンポーネントの Properties pane からこの種のリンクを開くこともできます。リンクされたデータシートは新しいブラウザタブで開きます。
 選択したコンポーネントのメーカー製データシートにすばやくアクセスできます。データシートは別のブラウザタブで開きます。
Octopart のコンポーネントページへのアクセス
各コンポーネントについて、Octopart site 内のそのコンポーネントページにすばやくアクセスできます(別のブラウザタブで開きます)。これを行うには、対象のコンポーネントを選択し、その右端にある ![]() コントロールをクリックして、関連メニューから Show in Octopart コマンドを選択します。
コントロールをクリックして、関連メニューから Show in Octopart コマンドを選択します。
 選択したコンポーネントの Octopart サイト上のページにすばやくアクセスできます。ページは別のブラウザタブで開きます。
ライブラリヘルスダッシュボード
Components ページ – Library Health – の上部領域には、Workspace コンポーネント全体の健全性の概要が高レベルで表示されます。
 Components ページの Library Health 領域には、Workspace に保存されているコンポーネントの健全性の要約が表示されます。
健全性の有用な視覚的インジケータに加えて、次の情報が表示されます。
-
Workspace 内のコンポーネント総数。これは、健全なコンポーネント数と問題(致命的エラーまたはエラー)があるコンポーネント数の合計です。
-
完全に健全なコンポーネントの数。
-
問題があるコンポーネントの数。なお、1 つのコンポーネントに複数の問題がある場合があります。
-
最近 Workspace に追加されたコンポーネントの数。これは、新規作成された最新バッチのコンポーネント数を表します。たとえば、昨日 Workspace で 2 つのコンポーネントが作成され、今日さらに 3 つ作成された場合、ダッシュボードに表示される数は
3になります。 -
Part Requests feature の一部としての、要求されたコンポーネントの数。
-
未使用コンポーネントの数。管理対象の回路図シートでも、設計内で直接も使用されていないものです。
メインのライブラリヘルスダッシュボードへのアクセス
詳細な Library Health ダッシュボードページ にアクセスするには、メインナビゲーションツリーの ![]() ボタンまたは Library Health をクリックします。ページ上部には、インターフェースのメイン Components ページ 上部にあるものと同じ概要情報が表示されます。その下には、サポートされている健全性チェック分析が表示され、それらはさまざまな Issue Themes にまとめられています。
ボタンまたは Library Health をクリックします。ページ上部には、インターフェースのメイン Components ページ 上部にあるものと同じ概要情報が表示されます。その下には、サポートされている健全性チェック分析が表示され、それらはさまざまな Issue Themes にまとめられています。
 詳細な Library Health ダッシュボードページにアクセスします。ここは問題をより詳しく分析するための司令塔です。
現在、Health Dashboard では次の問題テーマと健全性チェック分析がサポートされています。
Supply Chain
-
No Defined Part Choices– 少なくとも 1 つの Part Choice が定義されておらず、したがって Manufacturer Part へのリンクがない場合、コンポーネントはこの健全性チェックに失敗します。コンデンサや抵抗など、Part Choice の重要度が低い受動部品は、開いた問題タイル 内の Ignore Passive Components オプションを選択することで一覧から除外できます。 -
Stock Issues– 定義された Part Choice が在庫切れの場合、コンポーネントはこの健全性チェックに失敗します。 -
Risky Lifecycle States– Part Choice が廃止品、非推奨新規設計品(NRFND)、または無効である場合、コンポーネントはこの健全性チェックに失敗します。これらの状態では、設計に使用するコンポーネントの調達や供給で課題が生じる可能性があります。 -
Risky Lifecycle States() – 会社で Altium 365 SiliconExpert Integration 機能が有効な場合、上記の Lifecycle テーマを追加のライフサイクル分析データで拡張します。Part Choice が廃止品、非推奨新規設計品(NRFND)、または無効である場合、コンポーネントはこの健全性チェックに失敗します。
-
Predicted Supply Chain Issues() – この問題テーマは、会社で SiliconExpert Integration 機能が有効な場合に利用できます。End Of Life までの年数(YTEOL)プロパティが 1 年未満の場合、コンポーネントはこの健全性チェックに失敗します。YTEOL が 2 年未満の場合は Warning に分類されます。
Component Details
-
Uncategorized Components– Component Type が定義されていない場合、コンポーネントはこの健全性チェックに失敗します。 -
Invalid Parameter Type– コンポーネントに、適用されるコンポーネントテンプレートの現行バージョンに準拠しないパラメーターが1つ以上ある場合、このヘルスチェックは不合格となります。たとえば、パラメーターで不適切な値の単位が使用されている場合などです。この種のエラーは通常、Altium Designer のcomponent editorで示されます。 -
Missing required parameters– コンポーネントに、適用されるテンプレートで必須と規定されているパラメーターが存在しない場合、このヘルスチェックは不合格となります。この種のエラーは、Altium Designer のcomponent editorで感嘆符付きで示されます。 -
Using Outdated Template– コンポーネントが最新リビジョンではないコンポーネントテンプレートを参照している場合、このヘルスチェックは不合格となります。この問題を修正するには、Altium Designer でコンポーネントをediting in Altium Designer用に開き、最新のテンプレートが選択されていることを確認してから、そのコンポーネントを Workspace に保存します(File » Save to Server)。
Duplicates
-
Duplicates by Name– コンポーネント名が別のコンポーネントと同じ場合、このヘルスチェックは不合格となります。 -
Duplicates by Part Choices– 定義されている Part Choice が別のコンポーネントと同じ場合、このヘルスチェックは不合格となります。
Models
-
Using Outdated Models– 古いシンボルモデルまたはフットプリントモデルを参照している場合、このヘルスチェックは不合格となります。 -
Using Prohibited Models– 設計での使用対象ではないシンボルモデルまたはフットプリントモデルを参照している場合、このヘルスチェックは不合格となります。
ヘルスチェック分析の参照
ヘルスチェック分析テーマのタイルをクリックすると、そのチェックのより詳細な説明、問題解決のための推奨手順(利用可能な場合)、およびそのヘルスチェックで不合格となったすべてのコンポーネントの詳細リストが表示されます。
リストの既定のデータ列(Name、Description など)に加えて、ヘッダー領域の右端にある![]() コントロールドロップダウンオプションから追加の列を加えることができます。ウィンドウ内でShow Moreを選択すると完全な一覧が有効になり、パラメーター名をチェックすると、そのデータがメイン分析リストの列として追加されます。
コントロールドロップダウンオプションから追加の列を加えることができます。ウィンドウ内でShow Moreを選択すると完全な一覧が有効になり、パラメーター名をチェックすると、そのデータがメイン分析リストの列として追加されます。
 特定のヘルスチェックで不合格となっているコンポーネントを、そのチェックに対応する分析で確認します。
コンポーネントエントリを選択すると、右側のペインにその詳細情報が表示されます。これは、インターフェースのメインComponentsページからコンポーネントを参照したときに表示される内容と同じです。エントリの![]() ドロップダウンメニューを使用すると、その部品で利用可能な各種オプションにアクセスできます。
ドロップダウンメニューを使用すると、その部品で利用可能な各種オプションにアクセスできます。
- Open – この部品を専用のComponentビューで開き、完全な詳細を確認します。Accessing the Component viewを参照してください。
- Show in Octopart – Octopart website内の関連コンポーネントページにアクセスします。別のブラウザータブで開きます。
-
Open in Desktop App – このコンポーネント部品を Altium Designer のComponents panelで表示します。Altium Designer がまだ起動していない場合は、その実行ファイルを開くよう求められます(
X2.exe)。 - View/Edit Part Choices – Part Choicesビュー内のこの部品のComponentタブを直接開きます。ここでは現在の選択肢を詳細に確認でき、このコンポーネントに新しい Part Choices を追加することもできます。View/Edit Part Choicesを参照してください。
- Delete – 選択した部品をWorkspace Trashへ移動します(復元可能な「ソフト」削除)。
-
Exclude from results – このコンポーネント部品をヘルスチェック分析の対象から除外します。この部品はチェックされず、レポート統計にも含まれませんが、該当する問題テーマビューには、ヘルスチェックから除外されていることを示す灰色のアイコン(
 )付きで表示されます。テーマ全体もヘルスチェックから除外できる点に注意してください。詳細は以下のExcluding Components from a Health Check Analysisを参照してください。
ダッシュボード上部の情報リストで、未使用コンポーネントに関連付けられた数値(Unused)をクリックすると、それらのコンポーネントと詳細情報の完全な一覧が開きます。なお、Show and check used components onlyオプションが選択解除されている場合、現在使用されていない Workspace コンポーネント(プロジェクト、回路図シート、BOM ファイルなどで未使用のもの)を一覧表示できます。
 未使用コンポーネント数のリンクを選択すると、それらのコンポーネントの完全な一覧が開きます。
ダッシュボードの更新
Library Health レポートは、コンポーネント部品が変更された場合、たとえばコンポーネントがリリースされたり Part Choices が更新されたりした場合に、自動的に1日以内(通常は9時間後)に更新されます。それ以外の場合は、詳細分析ダッシュボードページで、すべてのレポートまたは特定のレポートを更新することで Health Reports を手動更新できます。
手動更新には、包括的更新(すべてのレポート)と部分更新(特定のレポート)の2つのレベルがあり、対応する更新ボタンから利用できます。
-
Comprehensive Dashboard Refresh – すべての問題テーマと、それに関連付けられたヘルスチェック分析全体に対して更新を実行します。このレベルの更新は、メインのLibrary Healthダッシュボードページ右上にある
 ボタンをクリックして実行します。更新中は、そのボタンが
 に変わり、サポートされている各問題テーマの横に
 というテキストが表示されます。
 包括的なダッシュボード更新を実行して完全なヘルスチェック更新を行います。これには、すべての問題テーマにわたるすべてのヘルスチェック分析が含まれます。
-
Partial Dashboard Refresh – 特定の問題テーマに関連するすべてのヘルスチェック分析に対して更新を実行します。このレベルの更新は2か所から実行できます。メインのLibrary Healthダッシュボードページで問題テーマエントリの横にある
 コントロールをクリックするか、その問題テーマ内のいずれかのヘルスチェック分析タイプを確認している際に、詳細ページの見出しにあるボタンをクリックします。
 部分的なヘルスチェック更新を実行します。これは、特定の問題テーマに関連付けられたすべてのヘルスチェック分析を対象とします。
ヘルスチェック分析からのコンポーネントの除外
ヘルスチェック分析から、コンポーネントフィルターカテゴリまたは個別のコンポーネントを除外できます。これを行うには、問題カテゴリを開いてExclude from Health Checkオプションを有効にし、カテゴリ全体をチェック対象から外すか、選択したコンポーネントのExclude from results ![]() メニューオプションを有効にして、そのコンポーネントのみをチェック結果から除外します。
メニューオプションを有効にして、そのコンポーネントのみをチェック結果から除外します。
 問題テーマ全体、または特定のコンポーネントをヘルスチェック分析から除外します。
 AI で翻訳